Dr. Margo Edwards
University of Hawaii
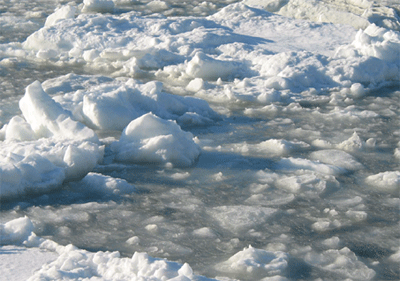
Photo credit: Margo Edwards
At the top of the world there is an ocean so cold that you are more likely to walk on it than swim in it. The ice cover is so thick and so varied in appearance that it’s easy to forget that you are standing on a body of water that is thousands of meters deep. As the Earth’s only ice-covered ocean, the Arctic Ocean uniquely influences our planet and the creatures living on it. It is also showing telltale signs of being negatively impacted by us.
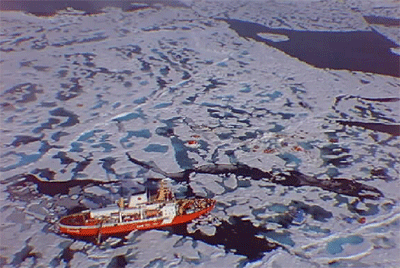
This image (above) was downloaded from the ARCSS Data Coordination Center at the University of Colorado. It’s a helicopter view of the Surface Heat Budget of the Arctic (SHEBA) research site. The Canadian icebreaker Des Groseilliers, ~ 98 meters long, was frozen into the ice for a year to make oceanographic, atmospheric and cryospheric measurements. Because the summer melt season is in progress the ice is covered by dark melt ponds.
Why study the Arctic?
Many research programs revolve around the Arctic Ocean’s uniqueness; for example, the arctic is the only region where you can study polar bears. However, the vast majority of arctic research focuses on how the Arctic Ocean influences global climate. Earth’s atmospheric circulation is generated by gradients that result from heat gain near the equator and heat loss near the poles. The presence of arctic ice cover hinders the amount of heat exchanged between atmosphere and ocean, essentially making summers cooler and winters warmer. Arctic snow and ice cover also impact Earth’s albedo , reflecting solar energy back into the atmosphere and influencing atmospheric circulation. Albedo is the ratio of light reflected by a body to the light received by it. This photograph helps illustrate the concept of albedo. Imagine shining a spotlight on the water and the ice; the ice will reflect the light while the dark water will absorb it. The process is identical for solar radiation. The more ice cover there is, the more solar radiation is reflected and the cooler the Arctic remains. The more open water there is, the more solar radiation is absorbed, increasing Arctic temperatures. This is known as a positive feedback cycle .
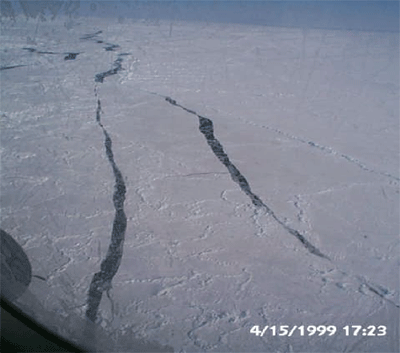
Photo Credit : Bernard Coakley
What happens to sea level if the Arctic ice canopy melts? (Activity 1):
Put some ice cubes in a glass and fill it with enough water to make all of the cubes float. Wrap masking tape around the glass so that the top edge of the tape is even with the water level. Allow the ice cubes to melt (this process can be sped up using a microwave if time is short. Don’t boil the water, just melt the cubes). Once the cubes are melted, check the water level. It shouldn’t have changed. What’s happening? Archimedes’ principle tells us that a floating object displaces an equal weight of water. Since ice is less dense than water, for a fixed weight, ice has more volume than water, which is why the cubes stick up above the water level. When the ice returns to liquid form it has the same volume as the water it displaced, hence no change in water level.
Now repeat the experiment except this time make sure there’s so much ice in the glass that it rests on the bottom. As before, fill with water but make sure the cubes remain in contact with the bottom. Mark the water level with tape and melt the cubes again. The water level will rise. In this case the weight of water and the weight of the ice are not balanced because the glass is helping to support the ice.
These experiments neatly illustrate the differences between Arctic ice (floating) and Antarctic ice (grounded). Melt the floating ice and sea level remains the same. Melt the ice that’s supported by land and sea level rises.
Melting the arctic ice canopy won’t directly affect global sea level, but the warming that results from removing this layer of insulation between the ocean and atmosphere in the Arctic Ocean ultimately will. If the ice canopy is removed and less sunlight is reflected back into the atmosphere, global temperatures will rise. This will cause glaciers on land to melt and that WILL raise sea level. This could be what’s happening to the Greenland ice cap now.
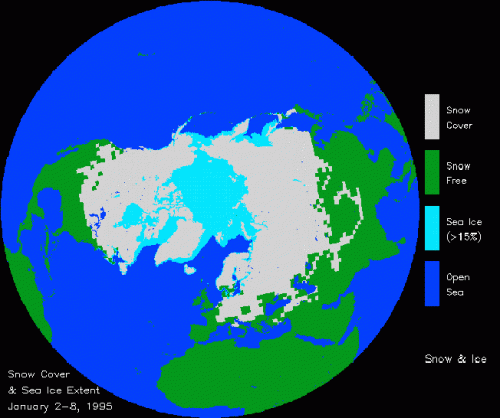
Since the 1980’s scientists have used satellites to monitor the extent of snow and ice cover in the Arctic. This map of Earth’s northern hemisphere shows snow cover and the extent of pack ice for arctic regions in January 1995. The satellite maps show that during the last two decades the extent of the polar ice pack has decreased. Although it is more difficult to quantify changes in the thickness of pack ice, research indicates that polar ice thickness is also decreasing. These observations support the conclusion that the Earth’s climate is warming. The unanswered question is whether this warming is a part of the Earth’s natural cycle or is caused by humans.
This map (above) was downloaded from NOAA’s National Snow and Ice Data Center in Boulder, Colorado via the Northern Hemisphere EASE-Grid Weekly Snow Cover and Ice Extent website (http://nsidc.org/data/nsidc-0046.html). The data are now made available on CD-ROM.
How does arctic geology relate to global climate?
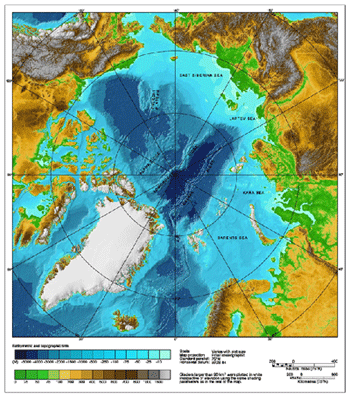
I’m often asked how I, as a seafloor mapping specialist, can study climatology. The answer is nicely provided by this map of Arctic Ocean topography ; that is, a map depicting the shape of the seafloor. The Arctic Ocean is where the northern Pacific and Atlantic Oceans mix. The Pacific waters arrive via the shallow Bering Strait at the top of the map; the Atlantic waters come through the deep Fram Strait and over the Barents Shelf at the bottom of the map. Since the Atlantic Ocean water is warmer and saltier than the Pacific water, instruments that measure temperature and salinity show us how these water masses interact. Oceanographers discovered that the locations of fronts , where the Pacific and Atlantic waters meet, are correlated with the shallow Lomonosov and Alpha-Mendeleev Ridges that cross the Arctic Basin. In other words, the terrain influences how the water mixes. Similarly, the water movement and temperature influence the distribution of pack ice and as we’ve already seen, the presence of the ice canopy affects global climate. It’s a terrific example of how all the different parts of our planet are intrinsically linked.
The International Bathymetric Chart of the Arctic Ocean is on-line at: http://www.ngdc.noaa.gov/mgg/bathymetry/arctic/arctic.html.
Jakobbson et al., 2000, New grid of Arctic bathymetry aids scientists and mapmakers, EOS, Trans. Am. Geophys. Union, 81, 89-96.
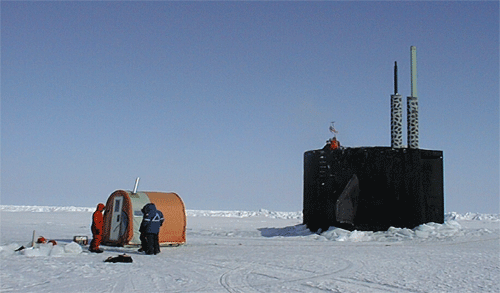
Photo: Mark Rognstad
How do we study the Arctic?
Studying the oceans is complicated, and the extreme conditions in the Arctic Ocean make scientific programs especially difficult. The primary methods used to collect data in this inhospitable environment involve satellite systems, airplane and helicopter surveys, ice-breaking ships, floating ice camps, and occasionally, nuclear-powered submarines. In 1999 I was fortunate to participate in an ice camp and submarine exercise called SCICEX. The U.S. Navy submarine I rode, USS Hawkbill , spent 46 days submerged under the arctic ice canopy, using downward-looking sonars to map the seafloor and upward-looking sonars to map the ice canopy while simultaneously measuring and sampling water through small openings in its hull. This photograph shows the USS Hawkbill surfaced outside the ice camp in April 1999. The orange tent is a staging area for National Geographic photographer Jay Dickman who, with assistance from Tom Lehman of Lamont-Doherty Earth Observatory, photographed the Hawkbill’s ascent and descent through the ice.
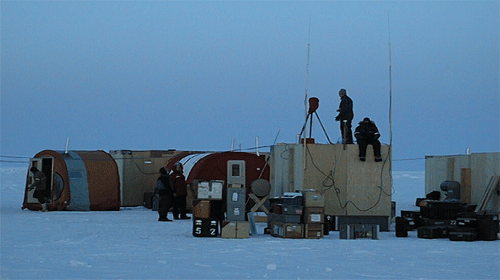
Photo credit: Margo Edwards
The SCICEX-99 mission was based at Ice Camp Lyon. The camp included tents for the generator, the mess hall and science operations, three hooches (a.k.a. plywood shacks) used for living quarters, and a command center where we communicated with people in Alaska and aboard the USS Hawkbill . The camp was situated on 3-meter thick pack ice about 275 kilometers north of Barrow, Alaska. It had been built three days before I arrived by hauling everything shown in this picture to the location on the a Twin Otter airplane.
The name “Ice Camp Lyon” was picked to honor Dr. Waldo Lyon, the man largely responsible for the development of Arctic nuclear submarines. Dr. Lyon had passed away before the start of the 1999 mission and one of the goals of our deployment was to scatter his ashes at the North Pole.
The camp’s primary function was to allow personnel to be transferred on and off the USS Hawkbill , but there were also several science experiments undertaken by Chief Scientist Dr. Peter Mikhalevsky and his colleagues. These included lowering transducers , which listen for sound waves, into the water column to record a signal transmitted across the Arctic Basin from Russia. By measuring the amount of time it took the sound wave to travel across the Arctic Ocean it was possible to monitor variations in water temperature. Another project tested a buoy that used a chemical reaction to melt upward through the pack ice. Scientists hope that buoys like this one can be used in the future to transmit information acquired by autonomous underwater vehicles (AUVs) to satellites.
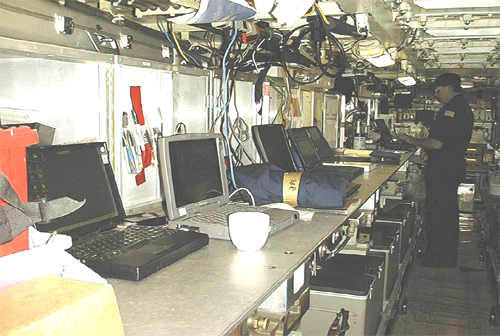
Photo credit: Mark Rognstad
Life on board the USS Hawkbill was warmer than at Ice Camp Lyon, but it was also a lot more crowded. The science “laboratory” was actually a working passageway in the torpedo room. One side of the passageway was used for our computers (seen here), while the other side held various types of equipment and displays. The ice chests located by the feet of Dr. Dean Stockwell were used to store water samples. Space is at a premium in a submarine, so the floor Dean is standing on is just a cover placed on top of cans of food that would be eaten later in the mission. Because people walked through the passageway almost constantly, we couldn’t have any chairs there but instead stood up or sat on the few available spaces on the benches to give our legs some rest. Just behind the silver lockers that are supporting the displays of these computers were bunks. In addition to being the science center of the submarine, the torpedo room also provided sleeping space for thirty sailors.
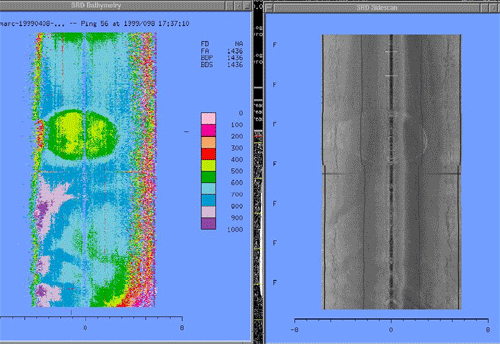
Image credit: Margo Edwards
My job during SCICEX-99 was to monitor and process data collected by the Seafloor Characterization and Mapping Pods (SCAMP), a sonar that recorded the depths and textures of the seafloor. This slide shows an example of the real-time display I monitored while underway. The color figure at left shows bathymetry , or seafloor elevations; the sidescan data (right) show finer-scale textures. In both the color and black-and-white swaths, the location of the submarine is in the center of the swaths, centered vertically over the point labeled “+2” at the bottom of both swaths. Distance is shown in kilometers from zero; port distances are negative and starboard distances are positive. This is a screen capture of a scrolling waterfall display; data at the top of the swaths were acquired after data at the bottom.
In the bathymetry swath, colors correspond to 100 meter depth intervals. The color bar for the depth scale, shown right of the bathymetry swath, repeats every 1000 m. The depths in this swath range from 1000 meters (the light pink points in the lower right corner of the swath) to 2000 meters (the dark purple points along the left-hand side of the swath). The oval feature near the center of the bathymetry swath is an underwater volcano with 300-400 meters relief. It’s located near a feature called the Northwind Ridge.
The sidescan swath shows the same terrain depicted in the bathymetry swath but plots the strength of acoustic echoes reaching the submarine from the seafloor. In this display, strong echoes are black and weaker echoes are white. It is just possible to discern the outline of the underwater volcano in the sidescan data.
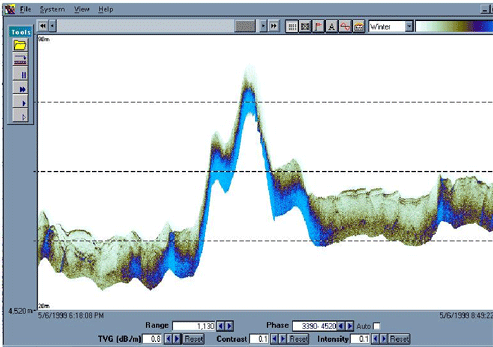
Image credit: Bernard Coakley
SCAMP also included a high-resolution subbottom profiler , a sonar that uses low frequency sound waves to penetrate into the seafloor and map layers of sediment in a vertical direction. The subbottom profiler basically showed us a slice through the upper 50000 meters of the seafloor in muddy and sandy areas. The data in this figure show a small volcanic cone on the Eurasian side of the Arctic Basin near the mid-ocean ridge spreading center known as Gakkel Ridge. To the left and right of the blue peak these data reveal thin, parallel layers that are interpreted to be sediments. No layers can be seen in the data above the blue peak in the center of the display, which we took to indicate that this volcanic peak was not covered by sediments. There are two possible interpretations for this observation: 1) that the sediments slid off the peak, or 2) that the peak was the product of a relatively recent eruption. By combining the subbottom profiler data with sidescan and bathymetry data for the same region, we were able to convince ourselves of the latter.
In the figure above dashed lines are spaced >300 meters apart.
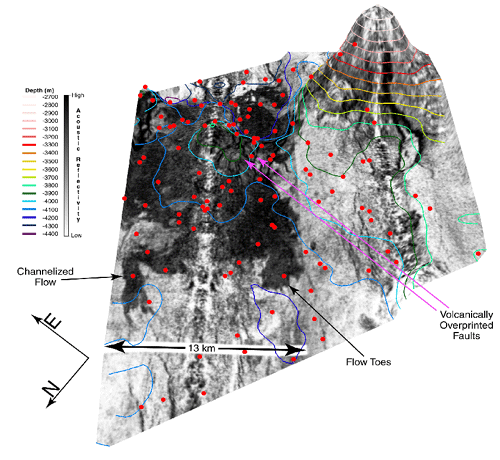
Image credit: Margo Edwards
This 3-D rendering (above) of the seafloor shows two different volcanoes, a tall, light gray peak on the right and a smaller dark gray peak on the left. If you trace the color contours around you’ll find the –4000 meter depth contour that encircles the top of the darker construct. It’s this dark feature that corresponds to the blue peak in the subbottom data. The strong contrast in shading between the two volcanoes means that one reflects sound echoes well while the other does not; that is, the light gray volcano is covered by sound-absorbing mud while the dark gray volcano is sediment free. We interpret this to indicate the dark volcano erupted more recently. Notice the shape of the dark region, how in some places it is channelized and in other places its edges have fingers and toes. This morphology , or shape, is consistent with lava flows observed on land. The fact that we can see these details from >3,500 meters away reinforces our theory that this flow erupted recently.
However, the most compelling reason for a recent eruption comes from the red dots. These represent epicenters of earthquakes recorded on land by the Global Seismic Network. Between January and September of 1999, the network recorded more than 250 seismic events in this area. NO events had been detected here for ~100 years before that. Fortuitously, the USS Hawkbill collected the sidescan data shown above in May, 1999. In other words, the submarine very likely passed 3,500 meters above an eruption while it was in progress! In the summer of 2001, a return to the Gakkel Ridge on a U.S. icebreaker led by Dr. Peter Michael of the University of Tulsa confirmed the presence of hot water emanating from this region. Efforts are now underway to return again, this time with a camera system to view the volcano first hand.
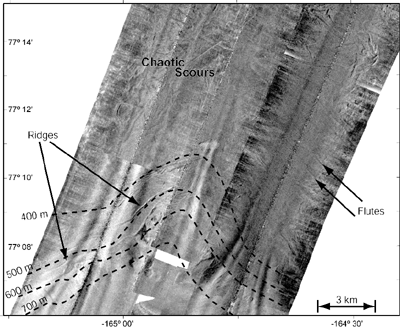
Image credit: Paul Johnson, Margo Edwards, Leonid Polyak
I began this keynote by discussing how topography influences water which in turn influences ice. One of the things I was most surprised to see on the SCICEX-99 expedition was how ice had influenced the land. There’s been an ongoing debate about ice in the Arctic Ocean and whether it was ever much thicker than the average 2-5 meters that it reaches now. The sidescan data collected by SCAMP settled the argument once and for all by discovering evidence of thick ice in the Arctic in many different parts of the basin.
This image shows SCAMP sidescan data overlain depth contour lines for the south side of the Chukchi Plateau. NW-trending lineations are flutes that indicate ~300 meter-thick ice flows originating from the Canadian margin scraped across the top of the plateau. Flutes are formed when large sheets of ice plow over rock like a bulldozer plowing through dirt. Ice gouges the sediments on the seafloor creating parallel ridges and troughs. Transverse ridges (labelled) parallel to isobaths , or lines of constant depth, mark the back-stepping of an ice shelf as sea level rose during deglaciation. Chaotic scours cover the <350-m-deep portions of seafloor, cross-cutting and obscuring the flutes. These scours reflect unrestricted movement of icebergs driven by winds and/or currents after the ice shelf had disintegrated. It is likely that the flutes once covered the shallower seafloor too but were obscured by erosion as the ice sheet melted, shrank and broke into icebergs that scraped shallowest regions.
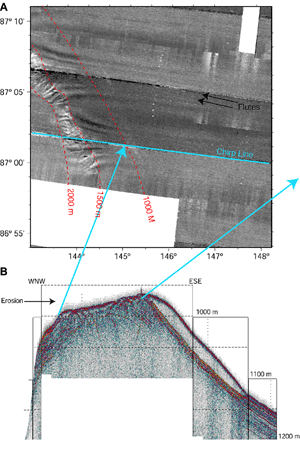
Image credit: Margo Edwards, Leonid Polyak and Bernard Coakley
As startling as the glacigenic (i.e., formed by glaciers) features were on the Amerasian side of the Arctic Ocean, we were amazed to discover another set of flutes on the Lomonosov Ridge, which runs almost directly under the North Pole, thousands of kilometers from the nearest continental sources of thick ice. The flutes shown in the SCAMP sidescan image (top) are located on terrain 950 meters under water. There is little evidence to suggest that the Lomonosov Ridge has recently subsided , or become deeper, so the ice that made these flutes must have been about one kilometer thick! At these water depths the flutes are very subtle features, although they are clearly oriented at a slight angle to the blue lines that represent the submarine’s track. Having discovered the flutes in the sidescan data we decided to compare them with the data from the subbottom system to determine whether there was additional evidence for ice scraping across the top of the Lomonosov Ridge. The light blue line labeled “Chirp Line” in this figure corresponds to the location of the data shown at bottom. The arrows indicate the start and end of the subbottom data.
The subbottom data clearly show evidence of erosion. In the lower figure the parallel lines on the left side are abruptly truncated, an indication that they’ve been scraped away. The ESE side of the Lomonosov Ridge is overlaid by a transparent layer with no recognizable lineations. The transparent layer has been sampled by Swedish researchers and is known to be composed of sediments that have been reworked and redeposited by ice.
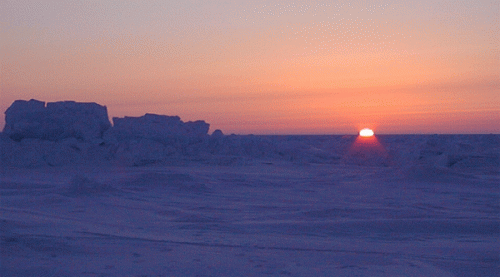
Image: Sunset from Ice Camp Lyon, Margo Edwards
Ironically, I had gone to the Arctic Basin to demonstrate how topography influences global climate; I’d left realizing that topography has also been affected by climate via these large ice sheets. My belief that we need to study Earth as a system had come full circle. That’s really what I enjoy most about studying the Arctic: that there are fundamental truths about our planet hidden up there, just waiting for someone to discover them. By venturing to this beautiful, barren, inhospitable place, I think I just might be learning the questions that I need to ask.

Leave a Reply