by Dr.Francisco P. Chavez
Monterey Bay Aquarium Research Institute
Classroom Exploration of the Ocean, Virtual Teacher worskhop Sep 20, 2004
Introduction
Webster defines climate as the average course or condition of the weather at a place usually over a period of years as exhibited by temperature, wind velocity, and precipitation. However, the more and more we look for the average climate we realize that one average is difficult to find because climate changes on many time scales. When I was quite a bit younger I remember listening to elders talk about how different the weather was “20 years ago.” I wondered if these statements were true or had their memory been affected so they could no longer accurately remember what it was like 20 years ago. After years of studying the consequences of climate variability on ocean ecosystems I now realize that there was a great deal of truth in what the elders spoke as there often tends to be.
What causes climate to change from year to year and decade to decade and what are the consequences of this climate variability? To date we lack complete answers to these questions although we have made significant progress over the past several decades particularly in understanding the consequences of climate variability. El Niño is probably the best example of how we have gained insight into climate variability. For years we thought these effects were restricted to the equatorial Pacific and the coastal oceans of the eastern Pacific. Careful studies in the center of the Pacific Ocean close to Hawaii uncovered El Niño effects there as well. The consequences of El Niño and it’s sibling La Niña are truly global (Figure 1). More recently our focus has shifted to decadal-scale changes that show remarkable basin-wide coherence and strong impacts on the oceans ecosystems. These studies of natural climate variability provide the foundation for future studies of climate change. This paper provides a brief introduction to El Niño and La Niña and a few examples of the biological consequences in marine communities.
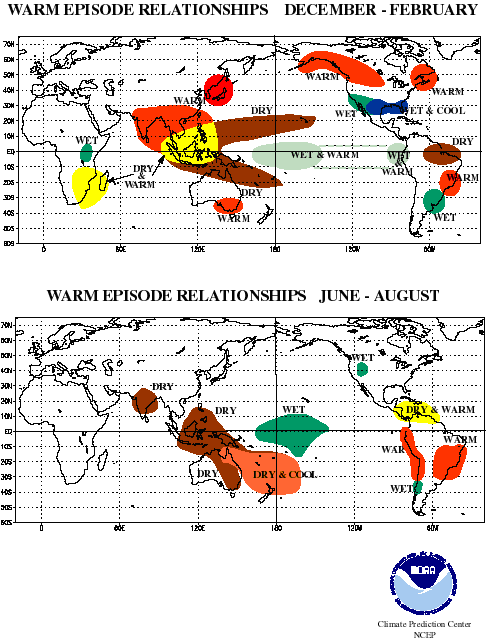
Figure 1. Climate impacts of El Niño (top) and La Niña (bottom) can be felt throughout the world.
What is El Niño Southern Oscillation ENSO)?
El Niño appears irregularly, once every three to seven years, and with varying intensity. Today it is associated with unusually warm water over large areas of the equatorial Pacific Ocean (Figure 2). As a result of the heat retention capacity of the ocean relative to the atmosphere these changes in ocean temperatures lead to changes in the global weather patterns. As an example hurricane activity in the north Atlantic and the southeastern United States is negatively correlated with El Niño. El Niño was originally identified and named by the fishermen of northern Peru , who recognized warm wet years during which their fisheries changed dramatically, floods caused damage and Peruvian deserts became grassland. The fisherman coined the name El Niño in the late nineteenth century after a warm southward current that appeared every year around Christmas (the Christ child= El Niño). Years of unusually high rainfall in northern Peru were associated with what the fishermen thought was an intensification of the annual current. It was not until the 1960’s that a Swedish scientist by the name of Bjerknes, working at the Scripps Institution of Oceanography linked warming of the coastal ocean off Peru (and the equatorial Pacific) with larger scale climatic phenomena. It was then that a relatively small and inoffensive coastal current was associated with dramatic global weather disturbances. Over the last 30 years the influence of El Niño, on oceanic and atmospheric conditions throughout the globe has been well documented. El Niño, of course, has been along for much longer than that, it can be seen in proxy data (such as lake sediments, coral growth rings, tree rings and ice cores) going back hundreds and even thousands of years.
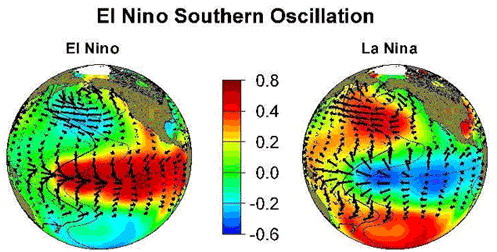
Figure 2. Standarized sea surface temperature (colors) and wind (arrows) anomalies (i.e. departures from the long term average) for El Niño (left) and La Niña (right). Note that the temperature anomalies are not uniformly distributed and certain areas actually cool during El Niño.
The first recognition of interannual changes in the atmosphere can be traced to a British scientist by name of Sir Gilbert Walker who in the 1920’s noticed that years when barometric pressure was high over southern South America it was low over Australia and other years the opposite occurred. Walker named this phenomena the Southern Oscillation. Today the Southern Oscillation Index (SOI) is calculated as the difference between the barometric pressure at Tahiti and that at Darwin , Australia . Together with sea surface temperature in the tropical Pacific the SOI is used by scientists to determine the occurrence and strength of El Niño (Figure 3). More recently, in the 1980’s, Peruvian scientists coined the name La Niña for anomalously cool temperatures along Peru . This phenomenon also has significant climatic impacts.

Figure 3. Time series of the Southern Oscillation Index (top) and sea surface temperature (SST) anomalies (bottom) for the equatorial Pacific. When there is a strong barometric pressure gradient (high in Tahiti and low in Darwin , Australia ) the SOI is positive and SST is anomalously cold and La Niña conditions exist. When the opposite occurs we have El Niño. Strong El Niños occurred in 1982-83 and 1997-98.
Even though El Niño has been extensively studied what initiates it remains an enigma. Theories ranging from chaos to volcanic eruptions in the tropics have been put forth. Today we are not yet able to accurately predict the timing and intensity of the phenomena. However once initiated the development of an El Niño is relatively well understood as a result of an array of ocean observing systems composed of satellites, ships and autonomous platforms (such as drifters and moorings) that have been in place for the last 25 years (Figure 4). In order to better understand El Niño it is informative to first look at the so-called normal condition. As a consequence of the earth’s rotation (see below for a description of the Coriolis effect) an asymmetry in winds and sea surface temperatures (SST) develops in the tropical Pacific. The eastern equatorial Pacific is remarkably and to some extent abnormally cool. SST can be less than 20 C despite continuous heating by the tropical sun. This cool water develops as a result of several inter-related processes. First there is a continuous export of heat (and water, the sea level in Indonesia is 30 centimeters higher than off Peru ) to the western Pacific by the easterly trade winds. The largest area of warm 30 C water (30 C is essentially the theoretical limit for ocean temperatures) of the entire globe, develops as a result in the western Pacific and eastern Indian Oceans . This area is referred to as the western Pacific warm pool. A second reason for the SST gradient, cool in the east and warm in the west, can be found in the vertical distribution of ocean temperatures. A thin surface layer of warm water is separated from a large reservoir of cool water by a third thin layer referred to as the thermocline (a region of rapid change in temperature). The thickness of the thin warm layer is not uniform in the ocean. As heat and water accumulate in the western Pacific the warm layer thickens to close to 200 meters and in the eastern Pacific it thins to 50 meters or less. The final driver of the east-west asymmetry in SST is associated with locally wind-driven (by the same trades) upwelling. Upwelling refers to vertical currents that move water from about 60-100 meters depth to the surface. In regions where the warm layer is less than 60 meters deep, like the eastern tropical Pacific, the water that is brought to the surface is very cold. The atmosphere responds directly to the warm surface layer. High pressure is established over cool waters (eastern Pacific) and low pressure over warm waters (western Pacific). In this sense the ocean and atmosphere are like a chicken and an egg. Which came first, the cool eastern Pacific or the trade winds? The reality is that they both developed together and it is this close coupling that is at the heart of El Niño
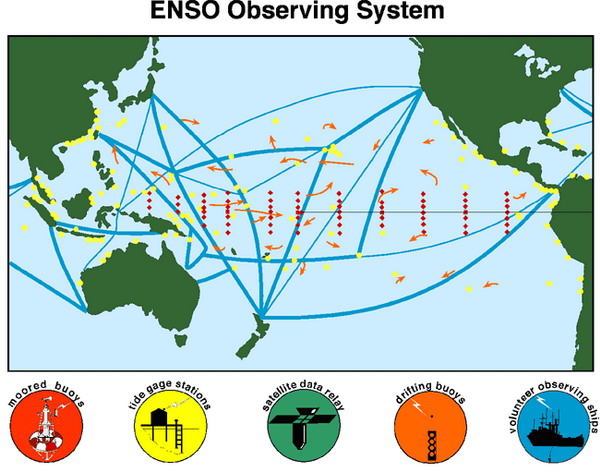
Figure 4. Array of measuring systems currently in place to monitor the occurrence of El Niño and La Niña.
In an over-simplistic sense El Niño is a redistribution of heat and water to create a more “natural” equatorial Pacific distribution of ocean temperatures i.e. warm waters extending from Indonesia to Peru . Given the chicken and egg nature of the ocean-atmosphere system it is also associated with a weakening of the easterly trades. It is important to note that the weakening of the trades is not uniform and is mostly restricted to the western and central Pacific. Again the question becomes what initiates El Niño, changes in winds or in the ocean. One theory suggests that before El Niño can occur there must be a subtle but large enough build-up of heat and water in the western Pacific. With an expanding area warm water comes an expansion of atmospheric convective activity. Indeed the first notable signs of El Niño are strong westerly winds along the equator in the western Pacific between Indonesia and the date line. Not all westerly wind bursts result in El Niño but the ones that do are reinforced in the following manner. The wind bursts spurn Kelvin waves (named after a scientist by name Kelvin who discovered them) that propagate along the equator from west to east, raising sea level and deepening the thermocline. When the Kelvin waves collide with South America they generate coastally trapped waves that propagate poleward towards Alaska and Chile . A depressed thermocline favors development of warm surface temperatures since warmer water now feeds upwelling in the equatorial cold tongue and the upwelling regions of California , Peru and Chile . This warmer SST further enhances the trade wind anomalies, again reinforcing changes in thermal structure. Eventually the Kelvin waves and associated thermal structure anomalies lead to changes in the major currents. Waters from the western Pacific warm pool migrate eastward and waters from north and south converge on the equator. The extent of the eastward penetration of warm pool waters into the central and eastern tropical Pacific is a function of El Niño intensity.
A key component of the circulation of upwelling regions is the presence of an undercurrent. This term is used to describe a current that flows at depth in an opposite direction of the surface current. Along the equator (and the coasts of North and South America ) this current develops in response to a pressure gradient established from the higher sea level in the western Pacific relative to the eastern Pacific. This extra weight pushes water westward along the equator at a rapid rate below the surface layers. This jet is trapped along the equator by an imaginary force resulting from the earth’s rotation. Scientists refer to this as Coriolis. The Coriolis effect is an inertial force described by the 19th-century French engineer-mathematician Gustave-Gaspard Coriolis in 1835. The effect of the Coriolis force is an apparent deflection of the path of an object that moves within a rotating coordinate system. The object does not actually deviate from its path, but it appears to do so because of the motion of the coordinate system. During El Niño the equatorial undercurrent first accelerates with the passage of the Kelvin waves and then weakens as the pressure gradient between the eastern and western equatorial Pacific first weakens and occasionally disappears.
Recovery from El Niño along the equator begins with an abnormal shallowing of the thermocline. Once the trade winds re-establish, SST can drop dramatically since cool waters feed the wind-driven upwelling. Abnormally cold or La Niña years often follow El Niño as the system “over-reacts”. We also now realize that the frequency and intensity of El Niño and La Niña may be related to the background state of the climate. By this we mean that there are other longer term cycles like those associated with El Viejo (old man) and La Vieja (old woman). This particular cycle has a period of around 50 years (like El Niño it is aperiodic). When the eastern Pacific is warmer than average, during El Viejo, El Niños may be more frequent and of greater intensity. As time series become longer, like those that we can reconstruct from paleo-oceanographic sources, and the effects of global warming perhaps set in our view of El Niño may change.
The effects of El Niño are best described along the equator and the coast of Peru . This is partly because the South American coast looks like an extension of the equator and the sea level and thermocline displacements associated with equatorial Kelvin waves has been well documented. At higher latitudes of the eastern Pacific, and off the western coast of North America in particular, the developmental sequence has not been as clear. Some have argued that the effects of El Niño off California are related to an expansion of the Aleutian Low, via atmospheric teleconnections, which suppresses upwelling-favorable winds. Others suggested that onset of the El Niño is related to remotely forced oceanic perturbations, since onset precedes changes in the Aleutian Low. It is likely that both of these processes are important with remotely forced perturbations leading the north Pacific atmospheric changes.
Conceptual models of ENSO-driven biological effects
The effects of El Niño on ocean ecosystems can be linked directly to the physical processes described above since the vertical distribution of nutrients (oceanographers refer to nutrients as fertilizer for plant growth) parallels that of temperature. The thin warm upper layer is low in nutrients and the deeper cold layer has high levels. This pattern is a result of the high absorption of light by water and gravity. Light needed for photosynthesis is essentially zero at 100 meters depth (on average much shallower) in an ocean with an average depth of 3800 meters. In this sunlight layer that oceanographers refer to as the euphotic zone, new or larger particles are created by phytoplankton growth (via photosynthesis and using light and nutrients) and their consumption by animals. Gravity acts to move these particles to the deep cold ocean. The deep ocean is similar to a compost that an average household might create in their backyard. The organic material in a compost degrades to inorganic (nutrient) minerals that are then once again available to plants. Processes that move this cold, nutrient-rich layer closer to the surface and vertical transport processes, such as upwelling, bring the nutrients in contact with sunlight and therefore enhance photosynthesis and biological production. A close look at the global distribution of chlorophyll tells us where these processes are at work (Figure 5). For example, the eastern and equatorial Pacific are regions of enhanced productivity.
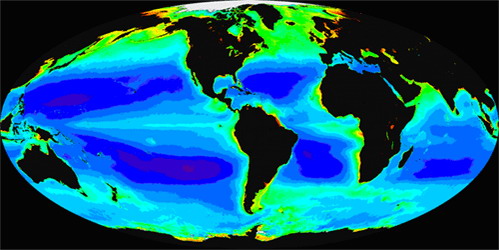
Figure 5. Global distribution of chlorophyll (the oceanographers index for phytoplankton or plant abundance) gathered from the first 6 years (September 1997-September 2003) of the SeaWiFS satellite sensor. Red, yellow and green represent high levels, and blue and purple are low levels.
An early conceptual model of biological production in upwelling systems suggested that there were two important physical processes responsible for enhanced productivity in these regions: (1) the thermocline, and more importantly the nutricline (nitrate), must be shallow, on the order of 40-80 m or less, so that (2) upwelling-favorable winds can draw nutrient-rich waters into the sunlit zone, thereby stimulating photosynthesis. During El Niño local upwelling-favorable winds in the eastern Pacific (ETP) are maintained and may even intensify. The dramatic reduction of biological productivity during El Niño has been therefore attributed to a deepening of the nutricline by remotely-forced Kelvin waves. Upwelling continues but the waters that are upwelled are low in nutrients, and productivity declines sharply (Figure 6).
Not all regions are less productive during El Niño. The opposite occurs in parts of the ocean where the thermocline and nutricline become shallower. These areas include the western Pacific and the central Pacific (i.e. around Hawaii ). The effects in these areas are much more subtle so we have tended to focus on the eastern Pacific effects.
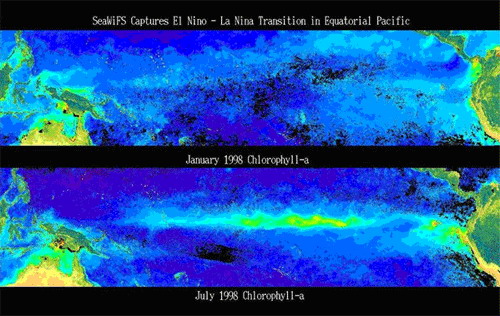
Figure 6. During January 1998 a full-fledged El Niño was in place and concentrations of chlorophyll along the equator and the coast of Peru were dramatically reduced. A dramatic change occurred in May 1998 as La Niña. By July 1998 the most dramatic blooms of phytoplankton ever observed along the equatorial Pacific developed and the coast of Peru was once again highly productive.
Biological consequences of ENSO in the eastern Pacific
The coastal oceans of the eastern Pacific are, on average, rich and productive. One view for this enhanced productivity was that cool and rich waters from the poles were advected towards the tropics by eastern boundary currents like the Peru and California Currents. A second view was that coastal upwelling, which occurs along eastern ocean margins when equatorward winds force surface waters offshore, was the primary source of nutrients for these regions. The characteristic signature of upwelling is a cool band along the coast separated from the warmer offshore waters by a series of fronts, plumes, and eddies, which can extend several hundreds of km from shore. Nutrients provided by the combination of coastal upwelling (0-200 km), equatorward transport (100~1500 km offshore) and thermocline doming support phytoplankton growth resulting in high-biomass ecosystems that support heavily-exploited fisheries. Periodically, once every three to eight years, El Niño disrupts this pattern of high primary productivity. During El Niño primary productivity of the eastern boundary current systems is dramatically reduced, in some cases to a quarter of its normal rate.
In the eastern Pacific during normal active upwelling deep waters low in phytoplankton are brought to the surface at a rate that exceeds phytoplankton growth and populations remain low at the site of upwelling. Phytoplankton increase offshore or downstream of the upwelling site and biological uptake eventually consumes the surface nutrients. Nitrate depletion typically occurs several hundred kilometers from shore (Figure 6). Highest near-coastal (0-25 km) concentrations of phytoplankton are found during weak upwelling or after strong upwelling favorable winds relax and phytoplankton blooms are brought onshore. During El Niño continued coastal upwelling favorable winds sustain enhanced production around the regions of active upwelling but the area of high primary productivity is reduced dramatically. There are also significant and at times dramatic changes in the ecosystems. In a relatively simple sense pelagic ocean ecosystems can be separated into two general types. The first that is characterized as coastal is typically supported by high levels of nutrients and is dominated by small colonial plants called diatoms. These diatoms can be consumed directly by small pelagic fish like anchovies and sardines or krill. In this very short food chain nutrients are transferred almost directly to the living resources. The second ecosystem characterized as oceanic has at its base very small plants (less than 1 micron in diameter) referred to as picoplankton. The smallest and most abundant plants are part of a group referred to as cyanobacteria and were not discovered until the 1980s. The consumers of picoplankton are again very small and together they comprise the so-called microbial food web. There are many transfers between nutrients and living resources in this oceanic ecosystem. The ecosystem changes associated with El Niño are described in Figure 7. A very narrow, diatom-dominated productive zone remains during El Niño but is only a fraction of what might be found during normal or La Niña conditions. There is some suggestion that phytoplankton that generate chemicals that are harmful to humans, such as dinoflagellates, might increase during El Niño. Large outgrowths of these organisms create red tides. The strength of the event apparently determines if dinoflagellates increase during El Niño. Weak to moderate events are more likely to trigger red tides.
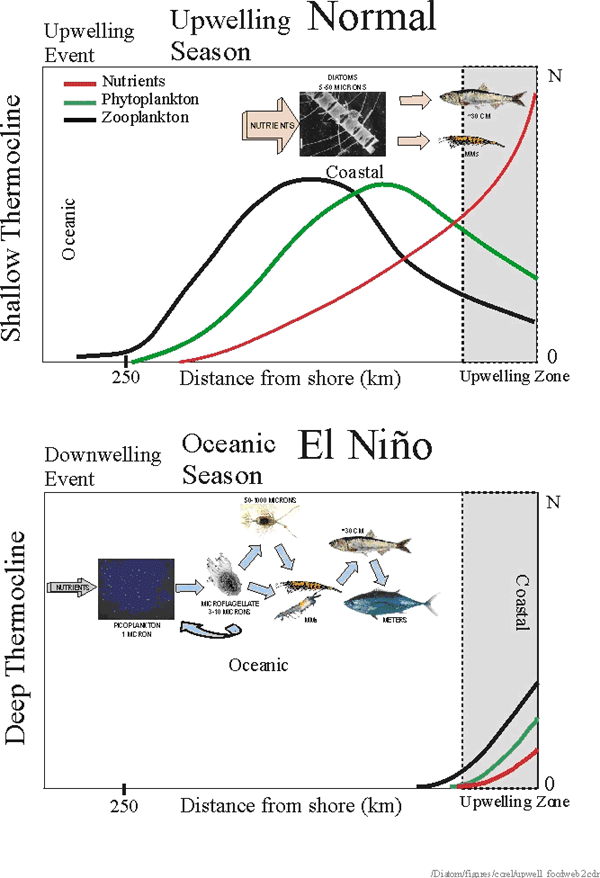
Figure 7. Conceptual model of offshore-onshore changes associated with El Niño.
The coastal ecosystem is dominated by large phytoplankton, typically colonial centric diatoms, and supports a food web with large zooplankton (i.e. euphausids) and small pelagic fish that graze directly on phytoplankton. During normal years this ecosystems occupies a large area (~200 km) and there is a spatial and temporal separation of sources (nutrients, phytoplankton) and sinks (phytoplankton, zooplankton). An “oceanic” ecosystem is found offshore and is dominated by picophytoplankton whose grazers are protists with similar growth rates creating an efficient recycling system. A complex food web evolves with a smaller proportion of the primary production reaching the upper trophic levels. During warm years the productive area is reduced dramatically and the oceanic ecosystem impinges on the shore.
Consequences further up the food chain
-
In the previous paragraphs we described the origin of the bottom up control of El Niño on marine ecosystems. By bottom up control we mean the supply of resources (i.e. nutrients) to (phytoplankton) populations. The less food that is available to the consumers of phytoplankton the less food that is eventually available to the top consumers. The effects on primary productivity then cascade up the food chain. In addition to bottom up effects there are also “top-down” controls. Those are the effects of consumers on their food populations. Below is a list of other effects El Niño has on marine ecosystems.
-
El Niño results in the emigration and immigration of populations. For example warm water species, such as Mahi Mahi, become abundant off California and Peru during El Niño. These voracious top predators consume the local populations that are already impacted by lower food supplies. The small pelagics, like anchovy and sardine, that commonly dominate the waters off California and Peru disappear to deeper, cooler waters or migrate north ( California ) or south ( Peru ). Seabirds and sea lions depend on these fish for the survival of their young and during extreme years can lose complete year classes.
-
There can be direct effects of sea level, temperature and currents. Higher sea level along the eastern Pacific during El Niño has been shown to impact certain intertidal populations. Warmer temperatures can enhance the growth rate of animals, as in the case of the scallop, Argopectens purpuratus , of Peru ; it increases dramatically during El Niño. The warmer temperatures also allow other animals, like shrimp or the red crab, to move into areas that they are typically excluded from. The difference between these effects and those described above for Mahi Mahi, anchovies and sardines is that these smaller, less capable swimmers are brought into their new habitat by anomalous currents that develop during El Niño.
-
The “catchability” of certain natural resources is affected. The example of the Peruvian anchovy is probably the most notable. During normal conditions the cool area off Peru is large providing ample area for the fish to “hide” from their primary predator, the fisherman. During the early stages of El Niño, small, very coastal pockets of cool water serve as refugia for the anchovy but make them extremely vulnerable to fishing.
- Perhaps the most interesting and more poorly understood effects are those that occur in the deep sea. El Niño-related changes in mesopelagic communities (jelly-fish, myctophids from depths of 400-1000m) have been reported as have changes in benthic communities. Are these a result of bottom-up, top-down or changes in currents and temperature? Most ecologists lean towards changes in food supply but the information we possess on these communities is incomplete.
Conclusions
Most of the media and even many scientists refer to El Niño negatively. For example in a paper in Nature a prominent scientist wrote: “the 1997–98 El Niño severely disrupted global weather patterns and Pacific marine ecosystems, and by one estimate caused $33 billion in damage and cost 23,000 lives worldwide”. However, as noted in the title of a paper by the German scientist Wolf Arnzt: “The two faces El Niño”, there are always two sides to a story. Examples are the dramatic increases in catch of shrimp and scallops off Peru and the reduction in hurricane activity in the Atlantic during El Niño. In many parts of the world, Peru and California for example, reservoirs used for drinking water and irrigation, are filled during rainy El Niño years. It is the extreme events, either a very warm or a very cold equatorial Pacific that can often lead to natural catastrophes. Given the recurring nature of El Niño it is clear that we have to learn to live with it. Better understanding of the physical nature of El Niño and its climatic and ecological consequences will aid in this regard.

Leave a Reply